Predictive Analytics in Supply Chain: What It Is, Why It Matters, and How to Implement It

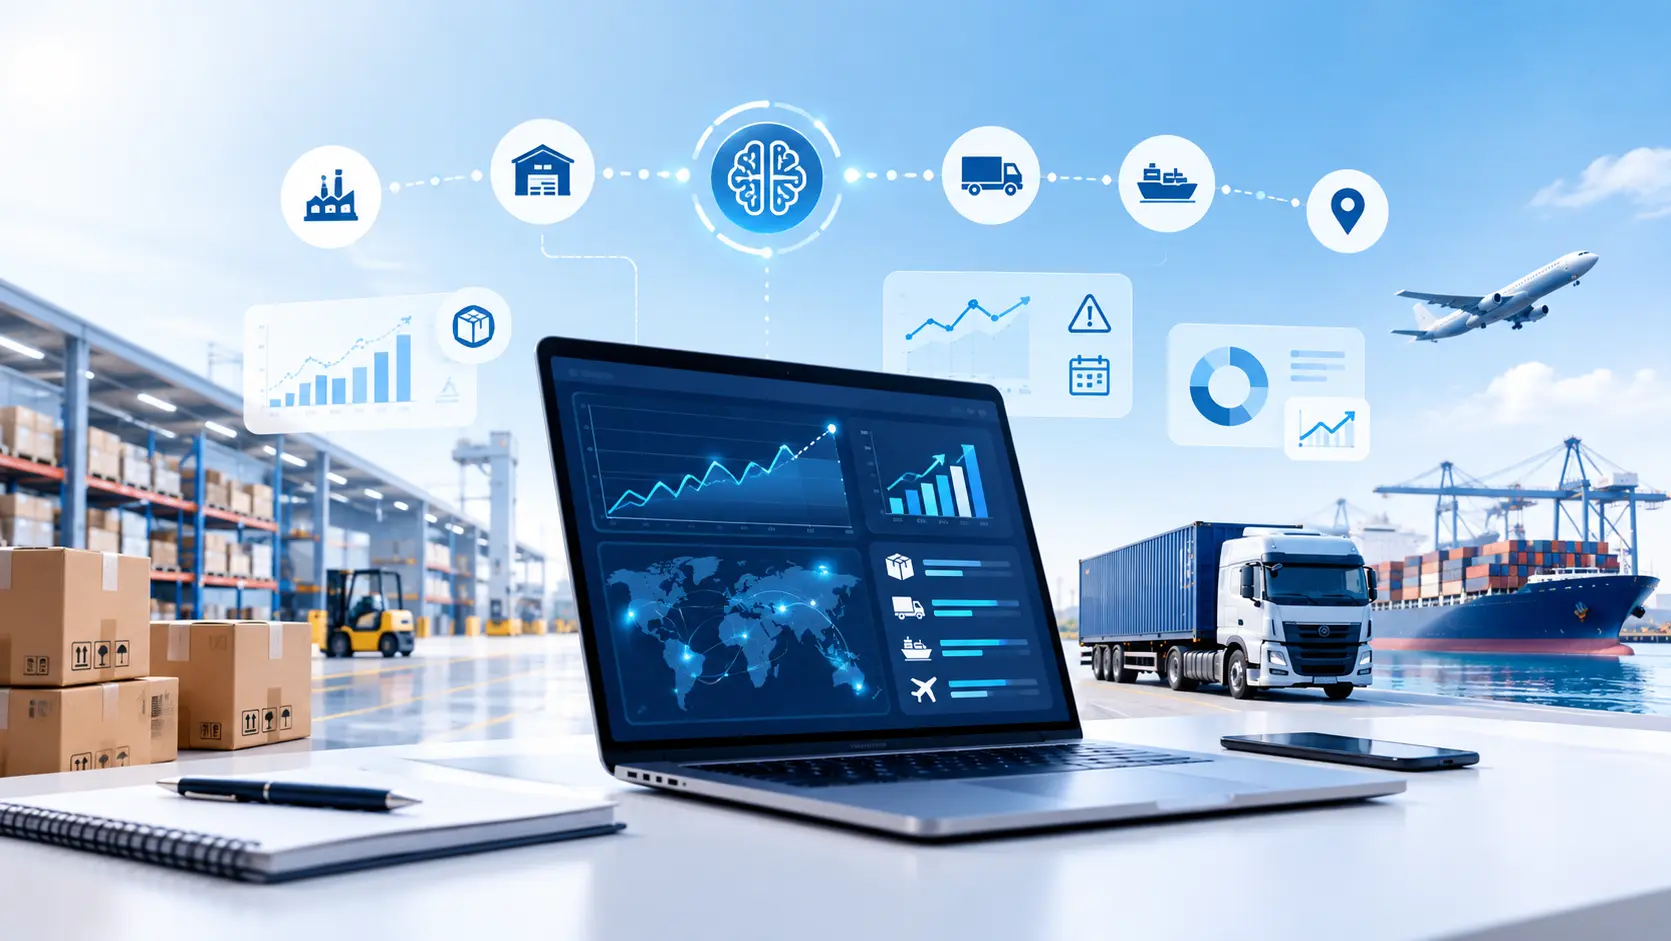
Predictive analytics in supply chain uses historical data, live signals, and machine learning models to forecast demand.
Predictive analytics in supply chain uses historical data, live signals, and machine learning models to forecast demand, flag disruption risk, and recommend inventory and sourcing decisions before problems reach the loading dock. Instead of reacting to a stockout or a delayed shipment after it happens, teams get a probability-based warning while there is still time to act on it. For US businesses running lean inventory against unpredictable demand and global sourcing risk, that lead time is the entire value proposition.
This guide covers what predictive analytics in supply chain actually means, why static forecasting keeps falling short, the real benefits and use cases, the tech stack behind it, what implementation costs and takes, and the mistakes that turn a promising pilot into a stalled project.
What Is Predictive Analytics in Supply Chain?
Predictive analytics in supply chain management combines statistical modeling, time-series forecasting, and machine learning to turn historical and real-time data into forward-looking recommendations: how much inventory to hold, which supplier is at risk of missing a delivery, and where a shipment is likely to face delay.
The inputs come from two places. Internal data includes point-of-sale transactions, inventory levels, shipment history, and IoT telemetry from vehicles and warehouses. External signals include weather forecasts, commodity prices, seasonal demand patterns, and macroeconomic indicators. Statistical methods like ARIMA handle seasonal, well-behaved demand patterns, while machine learning models, including gradient-boosted trees like XGBoost and neural networks, pick up nonlinear relationships that simpler models miss, such as how a regional weather event and a competitor promotion interact to move demand in ways neither factor explains alone.
Why Predictive Analytics Matters in Supply Chain Right Now
Static forecasting was built for a slower, more predictable world. It assumes next quarter looks roughly like last quarter, which breaks down the moment a port congestion event, a tariff change, or a regional weather disruption enters the picture. Supply chain teams working from static spreadsheets typically find out about a problem when a shipment is already late, not while there is still a window to reroute it.
Three pressures make this an urgent gap rather than a nice-to-have upgrade. Demand volatility has increased across most consumer and industrial categories since the disruptions of the early 2020s. Customers expect faster fulfillment windows than static planning cycles can reliably support. And geopolitical and tariff-driven cost shocks now move fast enough that a quarterly review cycle is too slow to respond to them. Predictive analytics closes that gap by embedding forecasting and risk detection directly into daily planning instead of a periodic review.
Benefits of Predictive Analytics in Supply Chain
Sharper demand forecasting: models that ingest seasonality, promotions, and external signals adjust continuously instead of relying on a static historical average.
Leaner inventory without more stockouts: dynamic reorder points based on real consumption patterns and supplier lead times reduce both overstock and shortage risk at the same time.
Earlier risk detection: monitoring weather, port congestion, and supplier performance in real time surfaces disruption risk while there is still time to reroute or resource.
Better supplier decisions: lead-time history and quality records turn supplier evaluation from an annual scorecard into a continuously updated risk signal.
Lower total cost: reduced expedited shipping, less safety stock sitting idle, and fewer manual reconciliation hours all show up directly in the operating budget.
Use Cases: Where Predictive Analytics Actually Gets Applied
Demand forecasting at the store or SKU level
Rather than forecasting demand at a regional or category level, models trained on hyperlocal data, weather, local events, and store-level sales history predict demand down to individual locations, which lets teams pre-position inventory instead of reacting after a stockout.
Inventory and reorder point optimization
Machine learning models continuously adjust reorder points and safety stock levels based on real consumption patterns and current supplier lead times, replacing static thresholds set once a year and rarely revisited.
Supply chain risk monitoring
Models trained on supplier performance history, weather feeds, and geopolitical indicators flag rising risk before it becomes a missed delivery, giving procurement teams time to activate a backup supplier or adjust order timing.
Predictive maintenance
IoT sensor data from manufacturing equipment and fleet vehicles feeds models that forecast component wear, scheduling maintenance just before predicted failure instead of on a fixed calendar interval that either wastes maintenance budget or misses a failure.
Digital twin simulation
A digital twin is a live, data-fed virtual model of a physical supply chain, a warehouse, a distribution network, a production line, that lets teams run what-if scenarios against real operating data instead of a static spreadsheet model. Reroute a shipment lane in the simulation, see the downstream cost and delay impact, and make the call before committing a real shipment.
Reverse logistics and return forecasting
Models trained on product attributes, seasonality, and customer behavior forecast return volume ahead of peak periods, letting teams pre-position return processing capacity instead of scrambling once returns hit.
The Tech Stack Behind Supply Chain Predictive Analytics
Most implementations sit on a similar stack, even when the specific vendors differ.
Layer | Common Tools |
Data ingestion and warehousing | Snowflake, Databricks, ERP and WMS/TMS exports |
Forecasting and ML frameworks | Python (scikit-learn, XGBoost, Prophet), TensorFlow |
Managed forecasting services | AWS Forecast, Azure Machine Learning, Google Cloud Vertex AI Forecasting |
Visualization and reporting | Power BI, Tableau, custom dashboards |
Integration and delivery | APIs, event streams, ERP/WMS/TMS connectors |
Managed forecasting services on AWS, Azure, and Google Cloud lower the barrier to a first pilot considerably, since they handle model training infrastructure. The trade-off is customization: a managed service works well for standard demand forecasting, but risk modeling that blends supplier data, weather, and geopolitical signals into one view usually needs a custom-built pipeline, which is where most off-the-shelf tools stop being sufficient.
How to Implement Predictive Analytics in Your Supply Chain
1. Define the business objective and KPI
Pick one measurable problem, reducing stockouts, cutting expedited freight spend, tightening forecast accuracy, and define the KPI you will measure against before any modeling starts.
2. Gather and unify the data
Pull ERP orders, shipment history, inventory levels, and POS data together with external signals like weather and seasonal calendars. This is usually the longest phase, not the modeling itself.
3. Clean and prepare the data
Duplicate records, missing values, and inconsistent formats across systems erode model accuracy fast. Budget real time for data engineering before a single forecast gets trusted.
4. Select the right modeling approach
Match the method to the problem: statistical time-series models for stable, seasonal demand, machine learning for nonlinear risk signals, and optimization models for routing and inventory allocation.
5. Validate against real-world scenarios
Test models against actual historical disruptions, not just clean average-case data, and track accuracy with standard metrics like MAPE and RMSE before rolling anything into production.
6. Integrate predictions into daily workflows
A forecast that lives in a separate dashboard nobody checks delivers no value. Route predictions into the ERP, trigger replenishment and alert workflows automatically, and capture the resulting decisions to keep improving the model over time.
What Does It Cost to Implement Predictive Analytics in Supply Chain?
Scope | Typical Range | What Drives the Cost |
Single use case pilot, one product line or region | $40,000 to $90,000 | Contained data scope, one forecasting model, proof-of-concept integration |
Multi-site rollout, ERP and WMS integration | $120,000 to $350,000 | Multiple data sources, custom risk modeling, automated workflow triggers |
Enterprise-scale platform, real-time risk and supplier scoring | $350,000+ | Continuous retraining, multiple system integrations, dedicated monitoring and governance |
Most of the cost sits in data engineering, not the forecasting model itself. A business with clean, centralized ERP and WMS data reaches a working pilot faster and cheaper than one still reconciling spreadsheets across regional systems, regardless of how sophisticated the model is.
Prebuilt Tools vs Custom Predictive Analytics: Which Fits Your Supply Chain?
Off-the-shelf forecasting tools get a pilot running fast and cost less upfront, which makes sense for a single, well-defined use case like standard demand forecasting on stable product lines. The limitation shows up once you need the platform to reflect your specific supplier network, your specific risk factors, or a workflow that spans more than one system. A custom-built solution costs more upfront but gives you full ownership of the models and the flexibility to adapt as your supply chain, and your risk profile, changes. Most businesses are better served starting with a prebuilt tool for a single use case and moving to a custom build once that use case is validated and the next one needs deeper integration.
Common Mistakes That Stall Supply Chain Analytics Projects
Starting with a company-wide rollout instead of a single, measurable pilot use case.
Underestimating the data cleanup phase, then losing trust in the model when early forecasts are inaccurate.
Choosing a model complexity that outpaces the team's ability to explain or trust its recommendations.
Building forecasts that live in a standalone dashboard instead of triggering real workflow actions.
Skipping a monitoring and retraining plan, letting the model drift silently as demand patterns shift.
Compliance and Data Considerations for US Supply Chains
Supply chain data carries its own handling requirements even without formal regulation attached. Import and customs data intersects with programs like CTPAT, the Customs-Trade Partnership Against Terrorism, which rewards verified supply chain security practices with faster customs clearance. Product traceability increasingly runs through GS1 standards and EPCIS event data, especially in food, pharmaceuticals, and retail, where lot-level traceability is becoming a baseline expectation rather than a differentiator. None of this is optional infrastructure once predictive models are making sourcing and routing recommendations based on that same data, so access controls and data lineage need to be part of the architecture, not an afterthought.
How Enorness Approaches Supply Chain Predictive Analytics
Enorness builds predictive analytics pipelines through our Data Engineering and Analytics practice, starting with a single measurable use case rather than a company-wide rollout, and pairing it with our Business Process Automation work to route predictions into actual replenishment and alert workflows instead of a dashboard nobody checks.
Our National Manufacturer case study covers how we applied this same approach to a manufacturing client's operational data, including the data cleanup work that took longer than the modeling itself, which is the part most vendor pitches leave out.
Ready to Turn Supply Chain Data Into Earlier Decisions?
The businesses getting real value from predictive analytics started with one measurable use case, not a platform overhaul. Book a Strategy Call with Enorness and we will map your data sources, pick the right first use case, and scope a pilot that shows results before you commit to a bigger build.
Frequently Asked Questions
What is predictive analytics in supply chain management?
It is the use of historical data, real-time signals, and machine learning models to forecast demand, detect disruption risk, and recommend inventory and sourcing decisions before problems affect delivery, replacing reactive, after-the-fact planning with proactive decision-making.
How is predictive analytics different from traditional demand forecasting?
Traditional forecasting relies on static historical averages that assume future demand looks like the past. Predictive analytics continuously updates forecasts using live signals like weather, promotions, and supplier performance, adapting as conditions change instead of waiting for the next quarterly review.
What data do you need to get started with predictive analytics in supply chain?
At minimum, ERP order history, inventory levels, and shipment data. Most implementations layer in external signals like weather, seasonal calendars, and supplier lead-time history to improve accuracy, but a first pilot can run on internal data alone.
Should we buy a prebuilt forecasting tool or build a custom solution?
A prebuilt tool is usually the right starting point for a single, well-defined use case like standard demand forecasting. Move to a custom solution once you need to model supplier-specific risk, integrate across multiple systems, or adapt the model to a supply chain that does not fit a generic template.
How long does it take to see results from a supply chain predictive analytics pilot?
A focused pilot on a single product line or region typically shows measurable results within 8 to 12 weeks, though most of that time goes into data preparation rather than model training. Enterprise-scale rollouts with multiple integrations take considerably longer.
What is a digital twin, and do we need one?
A digital twin is a live, data-fed virtual model of your physical supply chain that lets you simulate changes, a rerouted shipment, a supplier switch, before committing to them in the real world. It is valuable for complex, high-stakes networks, but most businesses get more immediate value from demand forecasting and risk monitoring before investing in full simulation capability.


Let's Build Something Extraordinary
Turn ideas into intelligent products that drive real business results.